

GROUPBY Function in Excel
The GROUPBY function summarises data by grouping rows and aggregating values.
GROUPBY Function Definition
The GROUPBY function summarises data by grouping rows and aggregating values. It works exactly like a pivot table, except it’s a formula. The GROUBY function was introduced in November 2023 as an alternative to using Pivot Tables.
Syntax: =GROUPBY(row_fields, values, function, [field_headers],[total_depth],[sort_order],[filter_array])
Breakdown of the inputs (arguments):
- Row_fields: The values you are grouping by. For example, names of employees.
- Values: The values you are aggregating by. For example, sales amounts.
- Function: The calculation for aggregating. For example, SUM of the sales amounts by employee.
- [Field_Headers]: Optional input to add or remove the headers.
- [Total_depth]: Optional input to add or remove totals and subtotals.
- [Sort_Order]: Optional input to sort from largest to smallest or smallest to largest.
- [Filter_Array]: Optional input to filter for specific rows. For example, only show the results for the employee “Bill.”
GROUPBY Example
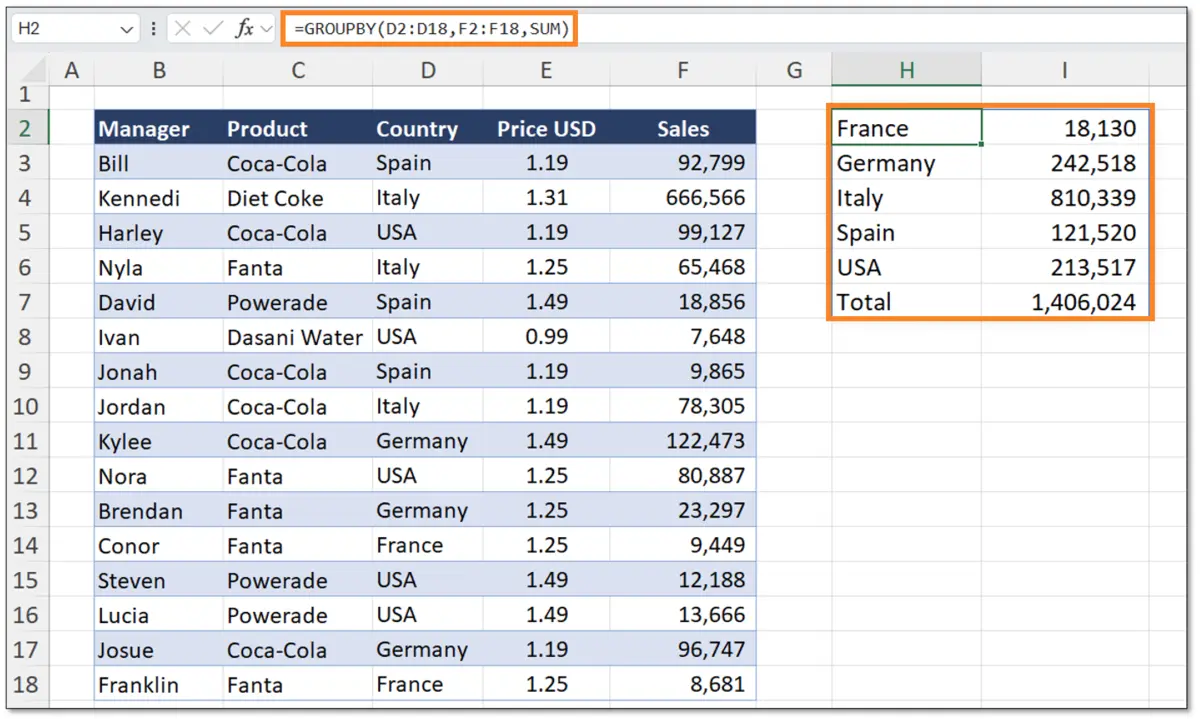
In the table below, suppose you want to find the sum of sales by country.
For this we use the GROUPBY function and select all of the countries as the row_fields, all of the sales as the values, and the SUM as the function. That returns a table breakdown of the sales by country.
GROUPBY Headers (Field_Headers) and Totals (Total_Depth)
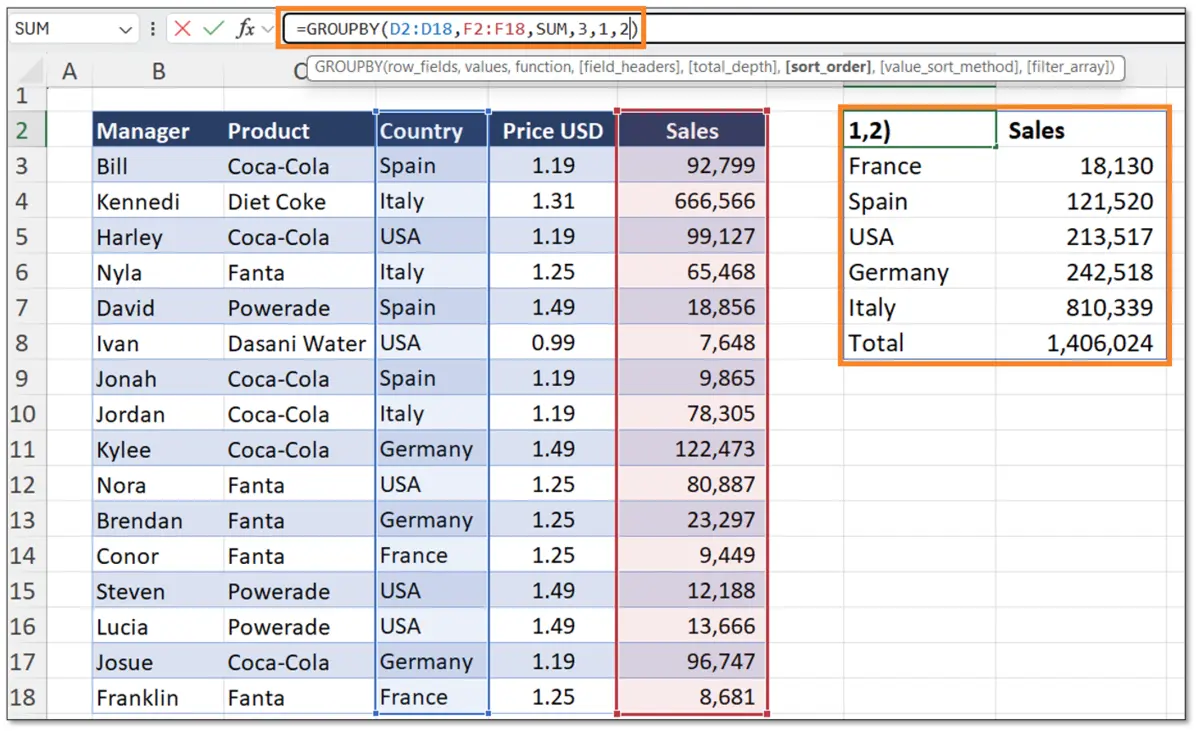
Using the same table as the example above, suppose we want to see the headers in the results table. For that we would type a 3 just after the SUM, which tells Excel to show the headers.
After the field_headers, if we wanted to show the totals, we would add a 1 to show the grand totals as the total_depth argument in the GROUPBY function.

GROUPBY Sorting (Sort_Order)
To sort the GROUPBY results table, you can use the sort_order optional argument. You can choose what column in the results table to sort by. For example, a 1 would sort by the country results column, while a 2 would sort by the sales results column.
In this case, we have a 2, so it sorts by the sales column from lowest to highest (ascending order). To switch to descending order add a negative sign in front of the number.
GROUPBY with Filter (Filter_Array)
To filter the GROUPBY results to only show a specific value match, use the optional filter_array argument. In the example below, we selected the country column and make it equal to Spain in quotations. That tells Excel we only want to GROUPBY those values that are in Spain. As such, the results table only shows Spain and ignores all other countries in the original source.
.webp)
PIVOTBY Function Example
The GROUPBY function only allows for row fields. If you also want to add column fields, you can use the PIVOTBY function instead.
The arguments are exactly the same as the GROUPBY, except there’s a column_fields argument as well.
In the example below, we added the countries as the rows and the quarters as the columns. As you can see in the results table, we have all the countries as row values, and all the quarters as column values.

GROUPBY vs Pivot Tables Difference
With Pivot Tables, you need to click the refresh button every time the original data changes. However, with the GROUPBY function the results automatically update. That’s the main difference between the two.
This applies to changing values in the linked dataset, as well as to new rows or columns being added. The GROUPBY function will automatically account for them, while the PIVOT TABLES will require a refresh.
GROUPBY and PIVOTBY Video Lesson
For a video tutorial of the GROUPBY and the PIVOTBY Functions, click on the video below.
Additional Resources
If you found this article useful, consider checking out our Excel for Business & Finance Course. Most courses are too simplified and don’t cover what it’s actually like on the job. That’s why we’ve drawn from our experience at industry-leading companies like Tesla, Amazon, or Goldman Sachs to teach you exactly what you need.
Other Articles You Might Find Helpful


Ready to Level Up Your Career?
Learn the practical skills used at Fortune 500 companies across the globe.